04
03
02
01
05
previous arrow
next arrow
04
03
02
01
05
previous arrow
next arrow

Goniophotometer
Photoglobe 4FA

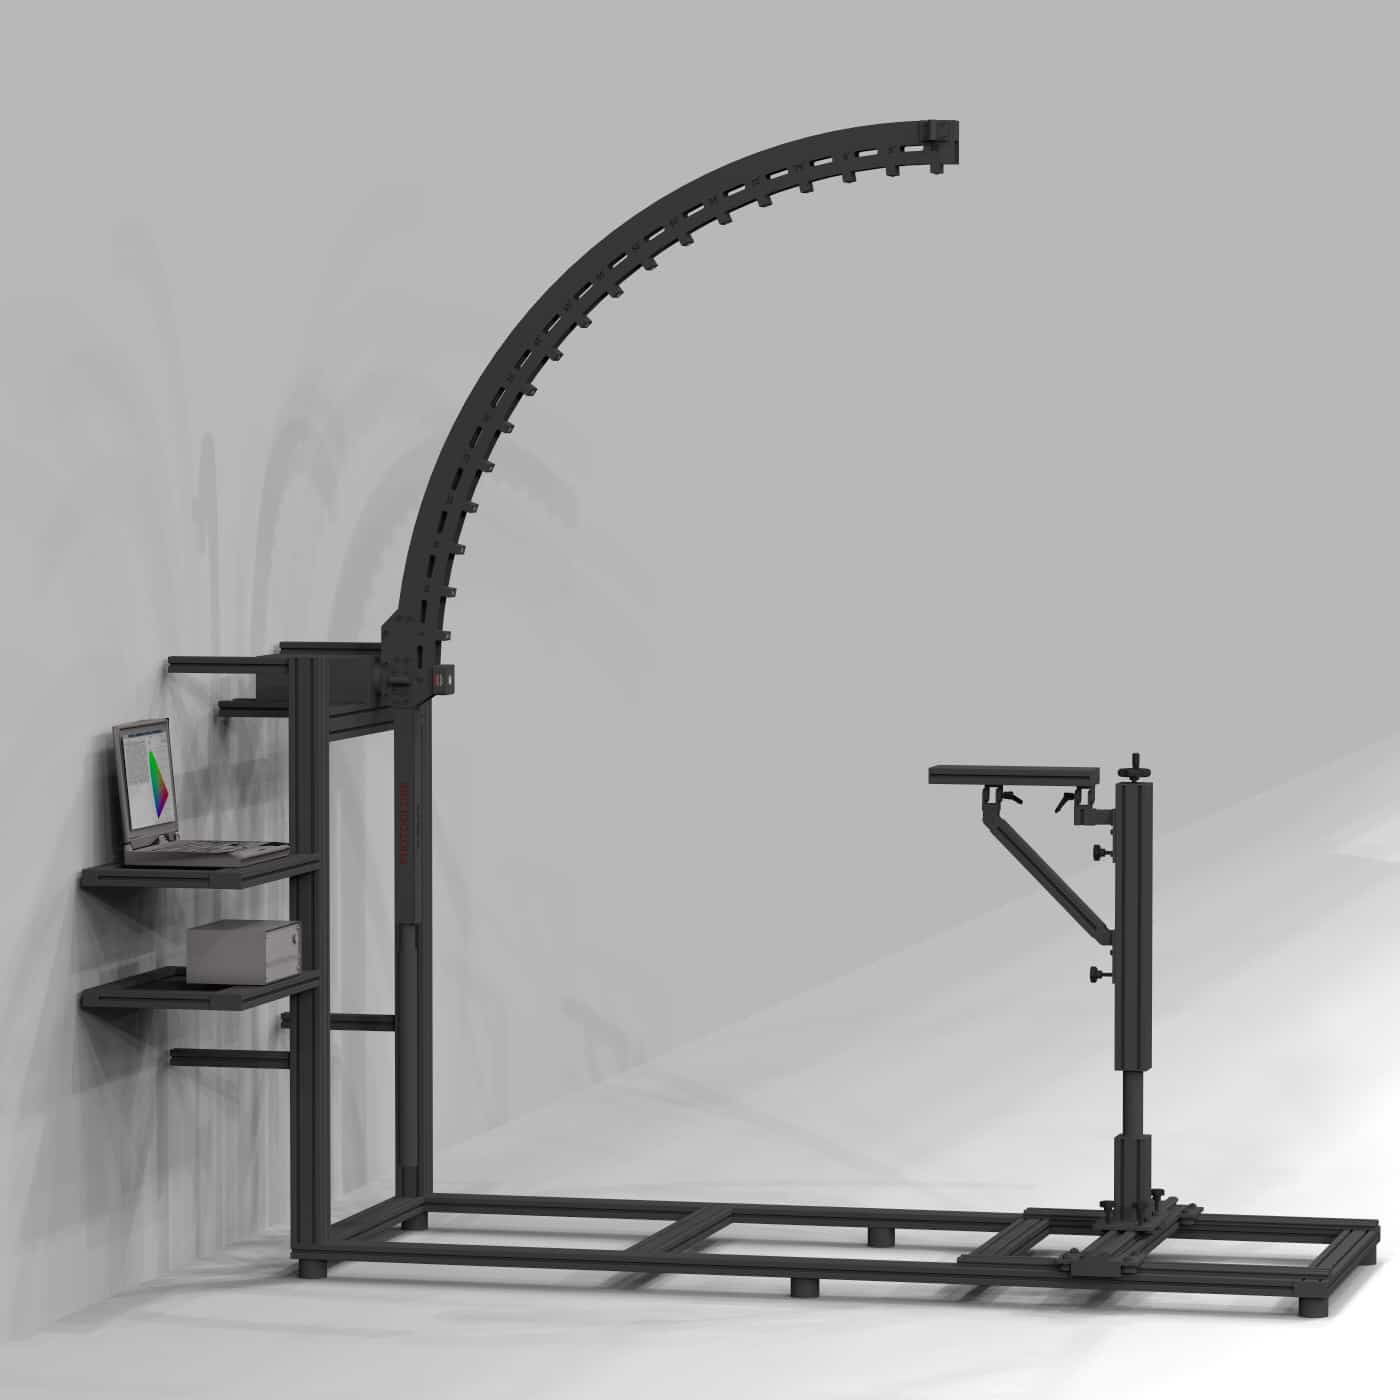
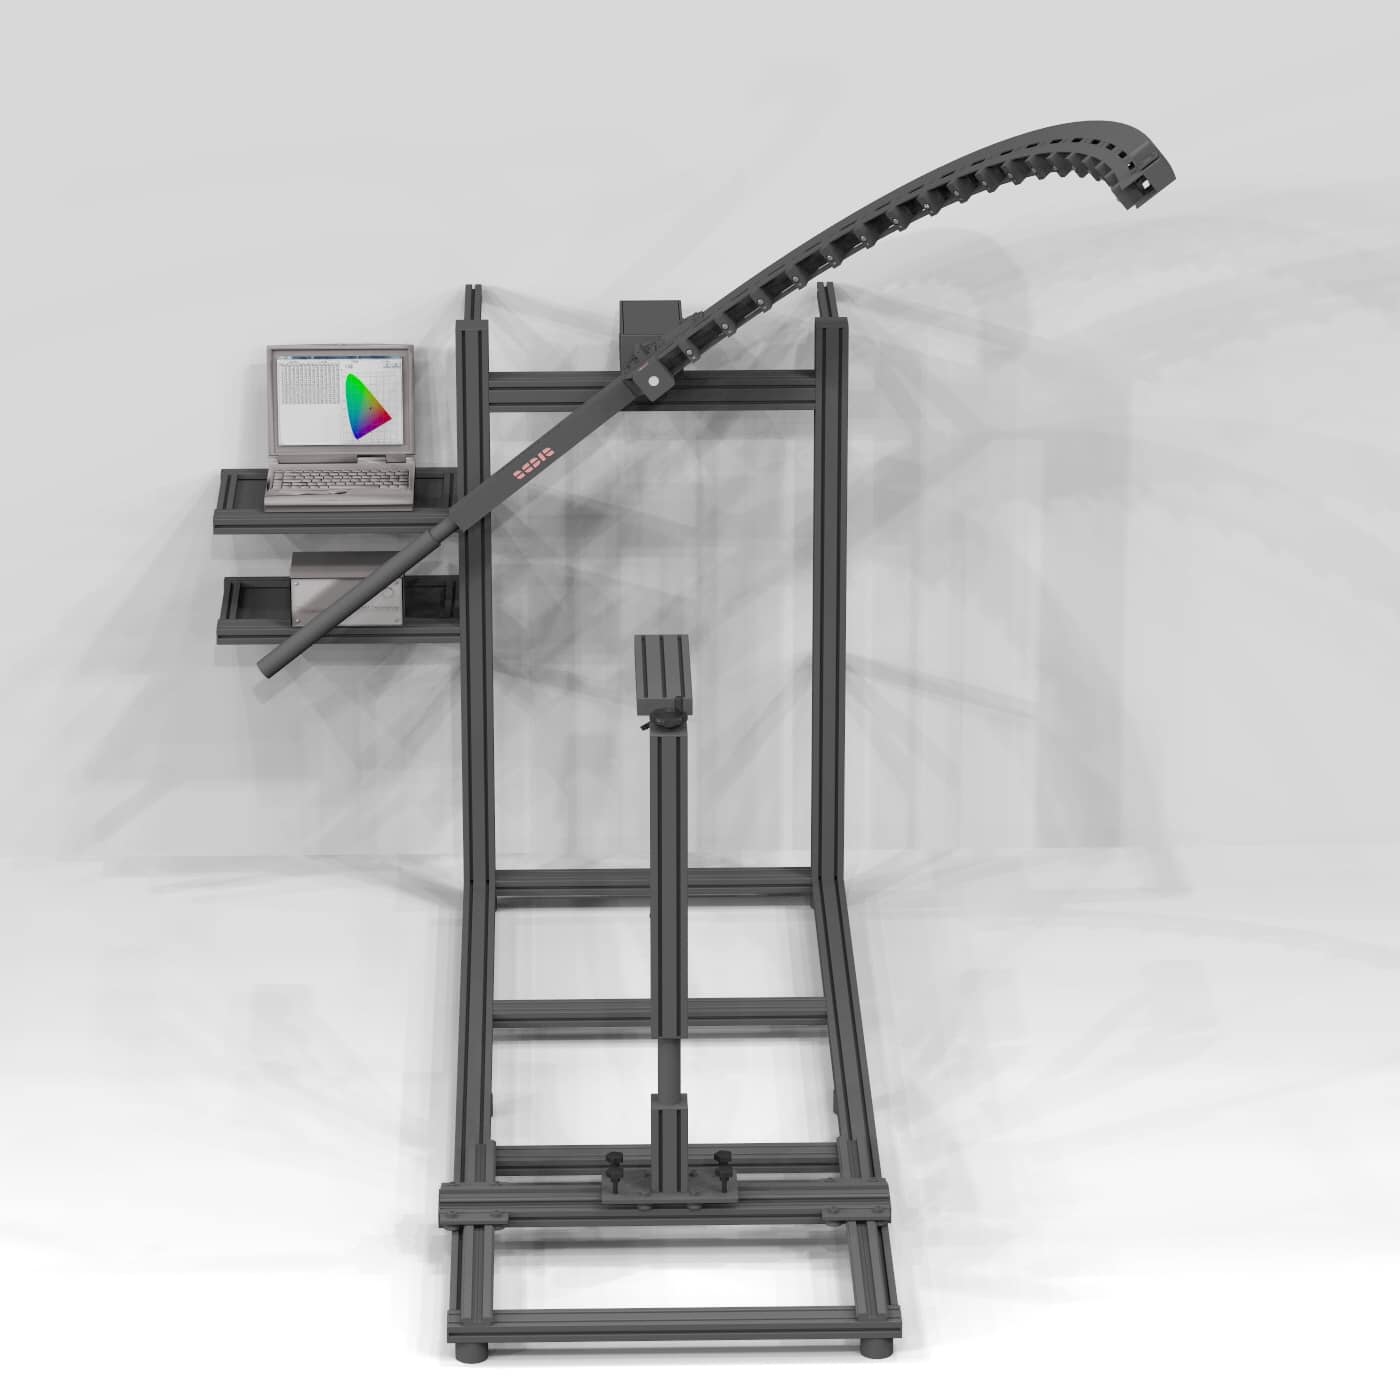
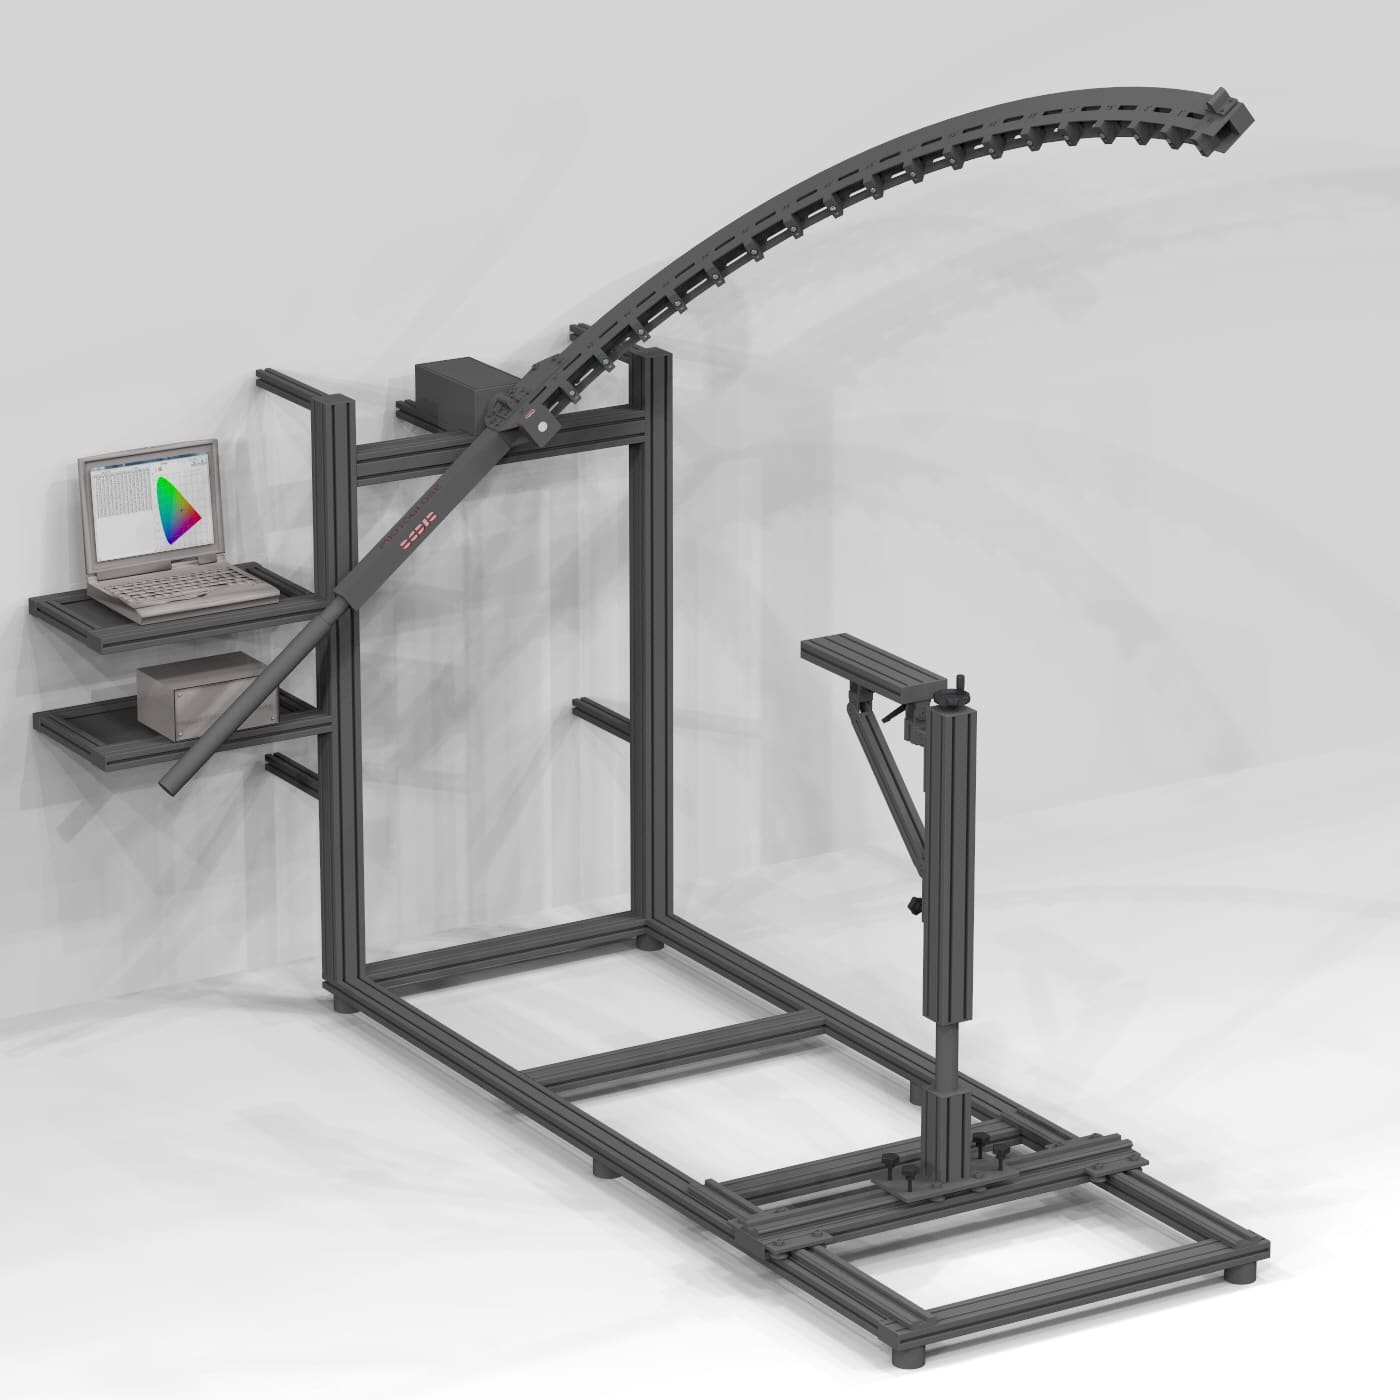
It measures the spatial distribution of the luminous intensity of luminaires, the luminous flux of light sources as well as all the colorimetric parameters.

  • Far-field goniophotometer with no mirrors
  • Fixed position of the luminaire throughout the entire photometric measurement
  • Possibility to measure luminaires in any working position
  • 100% compliant with UNI EN 13031-1and IES LM-79-08 standards
  • Fast measurement: 19 L class  sensors acquiring data simultaneously (0,01÷300.000,00 Lux)
  • PTB traceability for illuminance
  • METAS traceability for chromaticity coordinates and CCT
  • Installation and use in a small space (3,0 x 3,0 x 2,9 meters)
  • Possibility to measure luminaires with maximum weight of 70 kg
  • Possibility to measure luminaires with maximum dimensions of 2,0 meters
  • Easy positioning of the luminaire  
  • Easy luminaire testing for design purposes
  • Excellent quality-price ratio
  • Free post-selling assistance and support

WHY TO CHOOSE PHOTOGLOBE 4FA

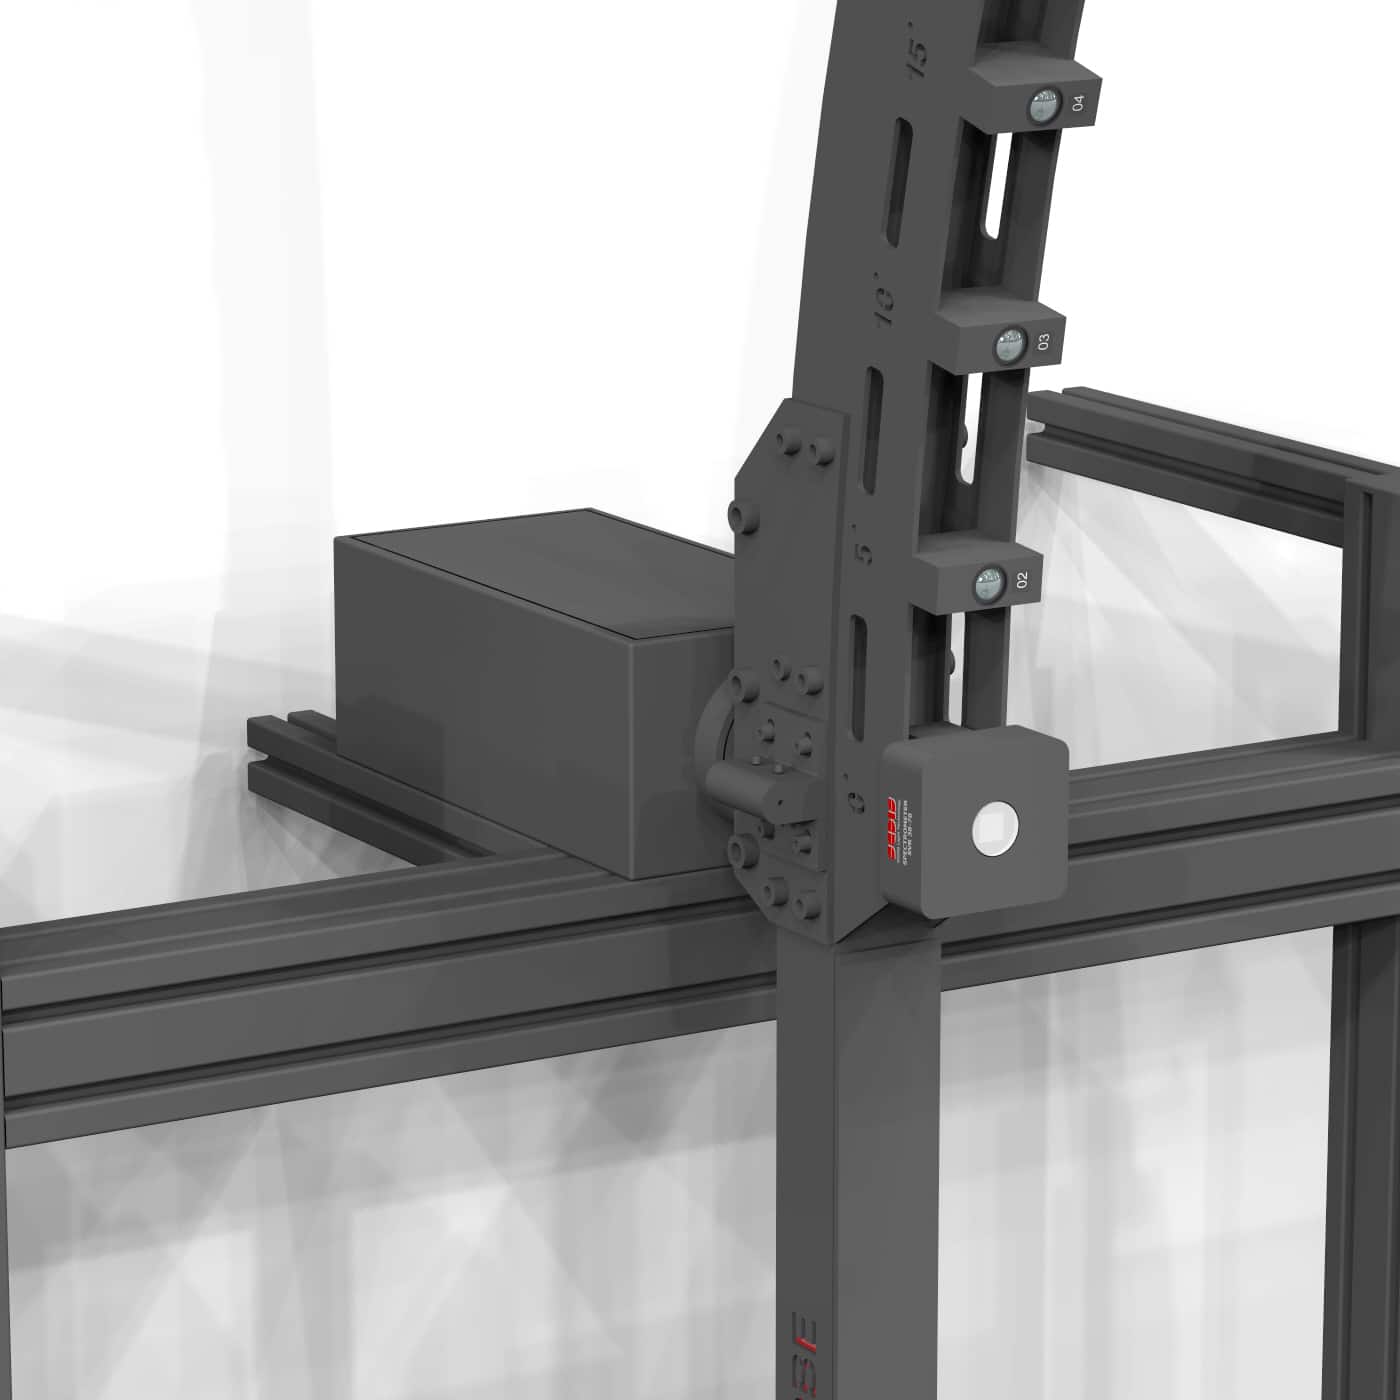
Photoglobe 4FA is a far-field goniophotometer using 19 acquisition sensors patented by Sedis Light Technology

and the SVRG 36-83 Spectrophotometer designed and manufactured by our company.  

These technologies:

CARRY OUT

  • absolute measurements
  • relative measurements
  • flux measurements for light sources (Lumen)

VERIFY

  • color uniformity between luminaires by means of the MacAdam Ellipse   
  • stabilization of light sources

EXPORT

  • EULUMDAT (.ldt) – photometric measurement
  • UNI11733 (.Xml) – photometric measurement
  • IESNA (.ies) – photometric measurement
  • IES TM-33-18 (.Xml) – photometric measurement
  • .cvs – data returned by the spectrophotometer

RETURN

  • Spectral irradiance (µW* cm-2 * nm-1)
  • Tristimulus values X, X1, X2, Y, Z
  • Chromaticity coordinates x, y
  • Chromaticity coordinates u’, v‘
  • Correlated color temperature (CCT)
  • Chromatic difference (DC)
  • Chromatic rendering index (CRI)
  • Color components (R1, R2, …. , R14)
  • Fidelity Index
  • Gamut Index

POST-PROCESSING SOFTWARE

Measurement data are processed by a powerful post-processing software.

The software generates a .PDF measurement report containing, in addition to the above listed data, the following:

  • efficacy (lm/W)
  • calculation of the beam of light of luminaires
  • polar diagram
  • Cartesian diagram
  • representation of chromaticity coordinates x, y  in CIE 1931 diagram
  • representation of chromaticity coordinates u’, v’ in CIE 1976 diagram
  • graphical representation of color components
  • graphical representation of the Gamut Area