Fotogoniometro Photoglobe 4FASC
Fotogoniometro Photoglobe 4FASC
Fotogoniometro Photoglobe 4FASC
Fotogoniometro Photoglobe 4FASC
Fotogoniometro Photoglobe 4FASC
Fotogoniometro Photoglobe 4FASC
Photoglobe 4FASC
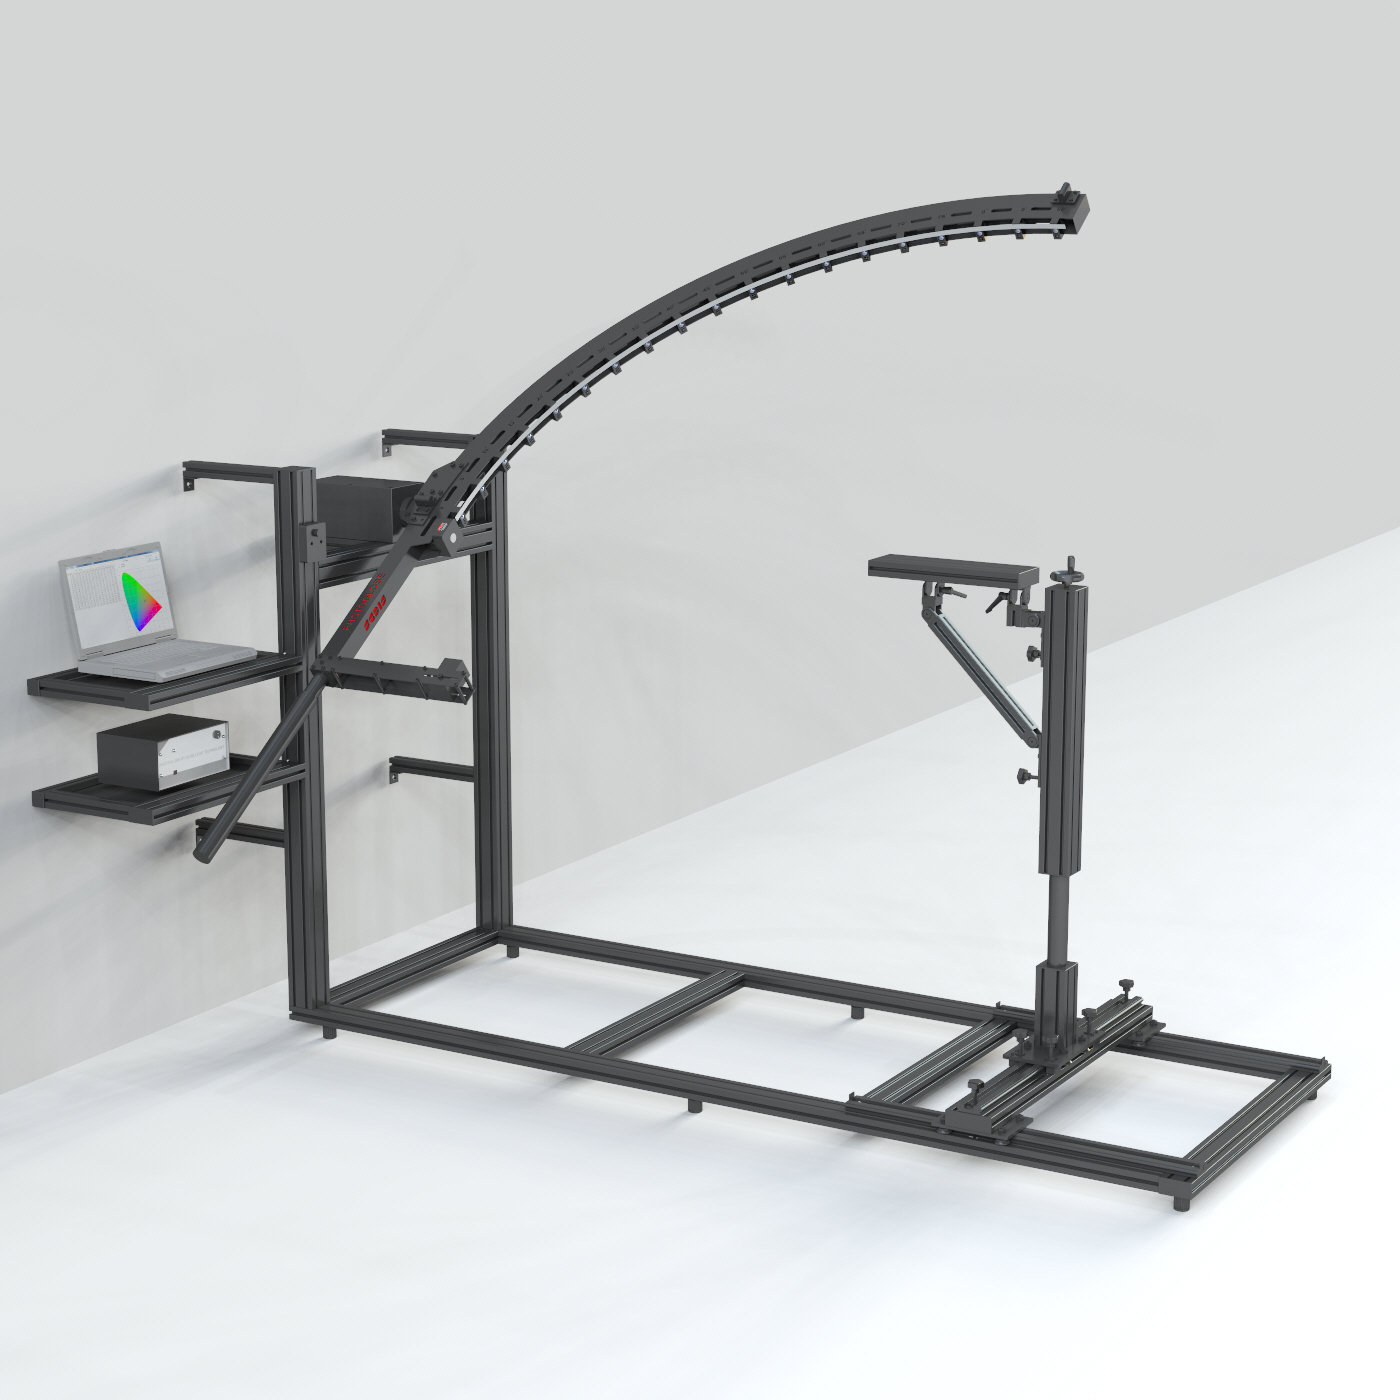
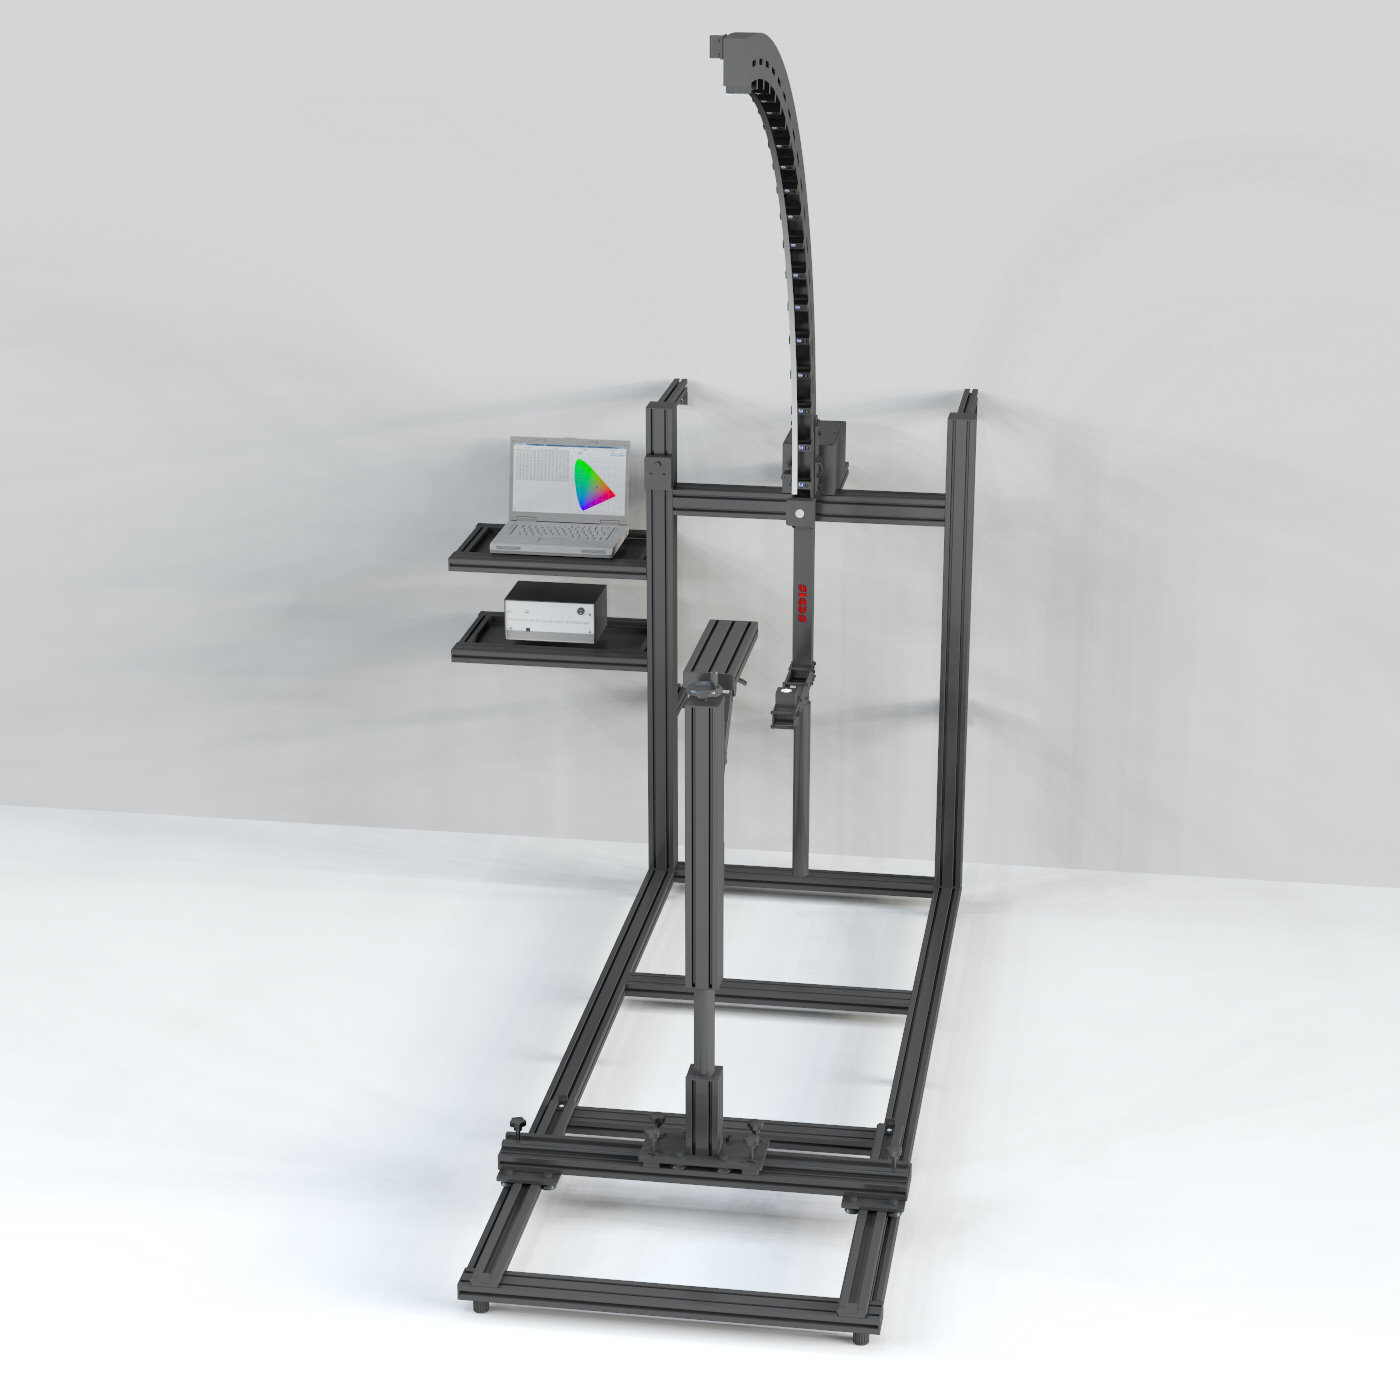
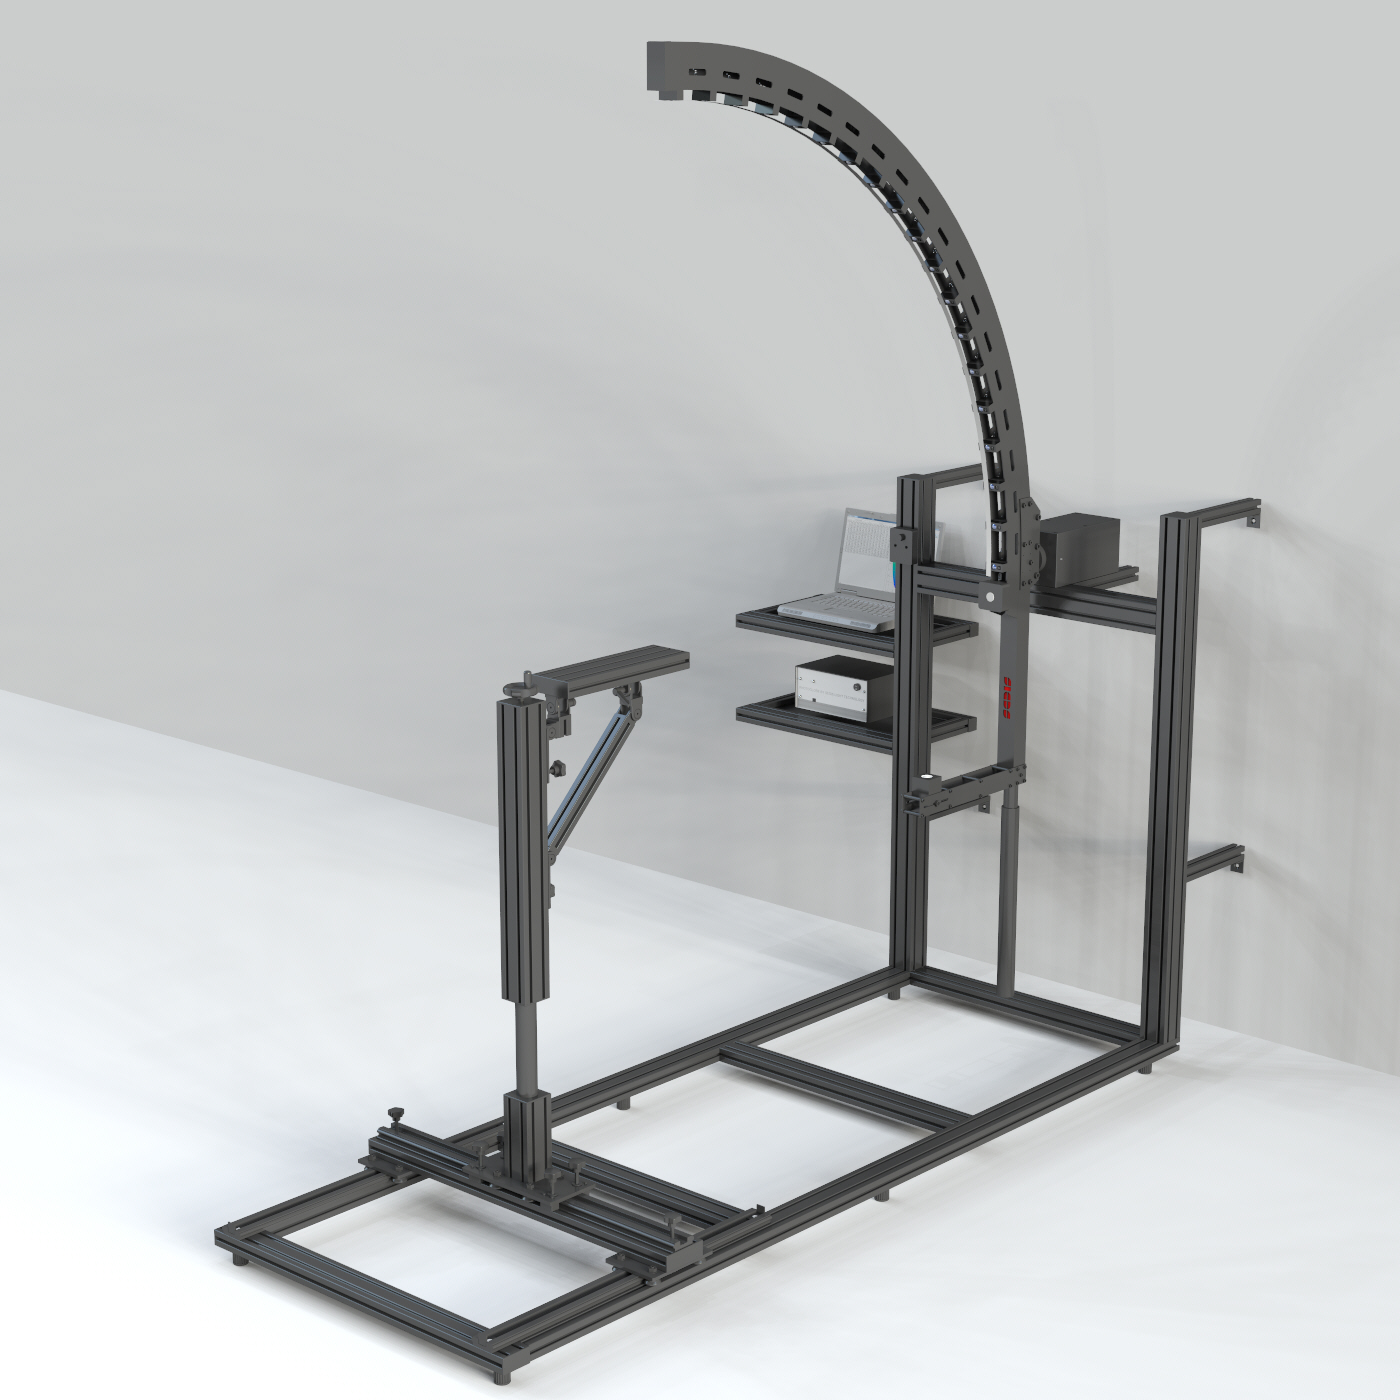
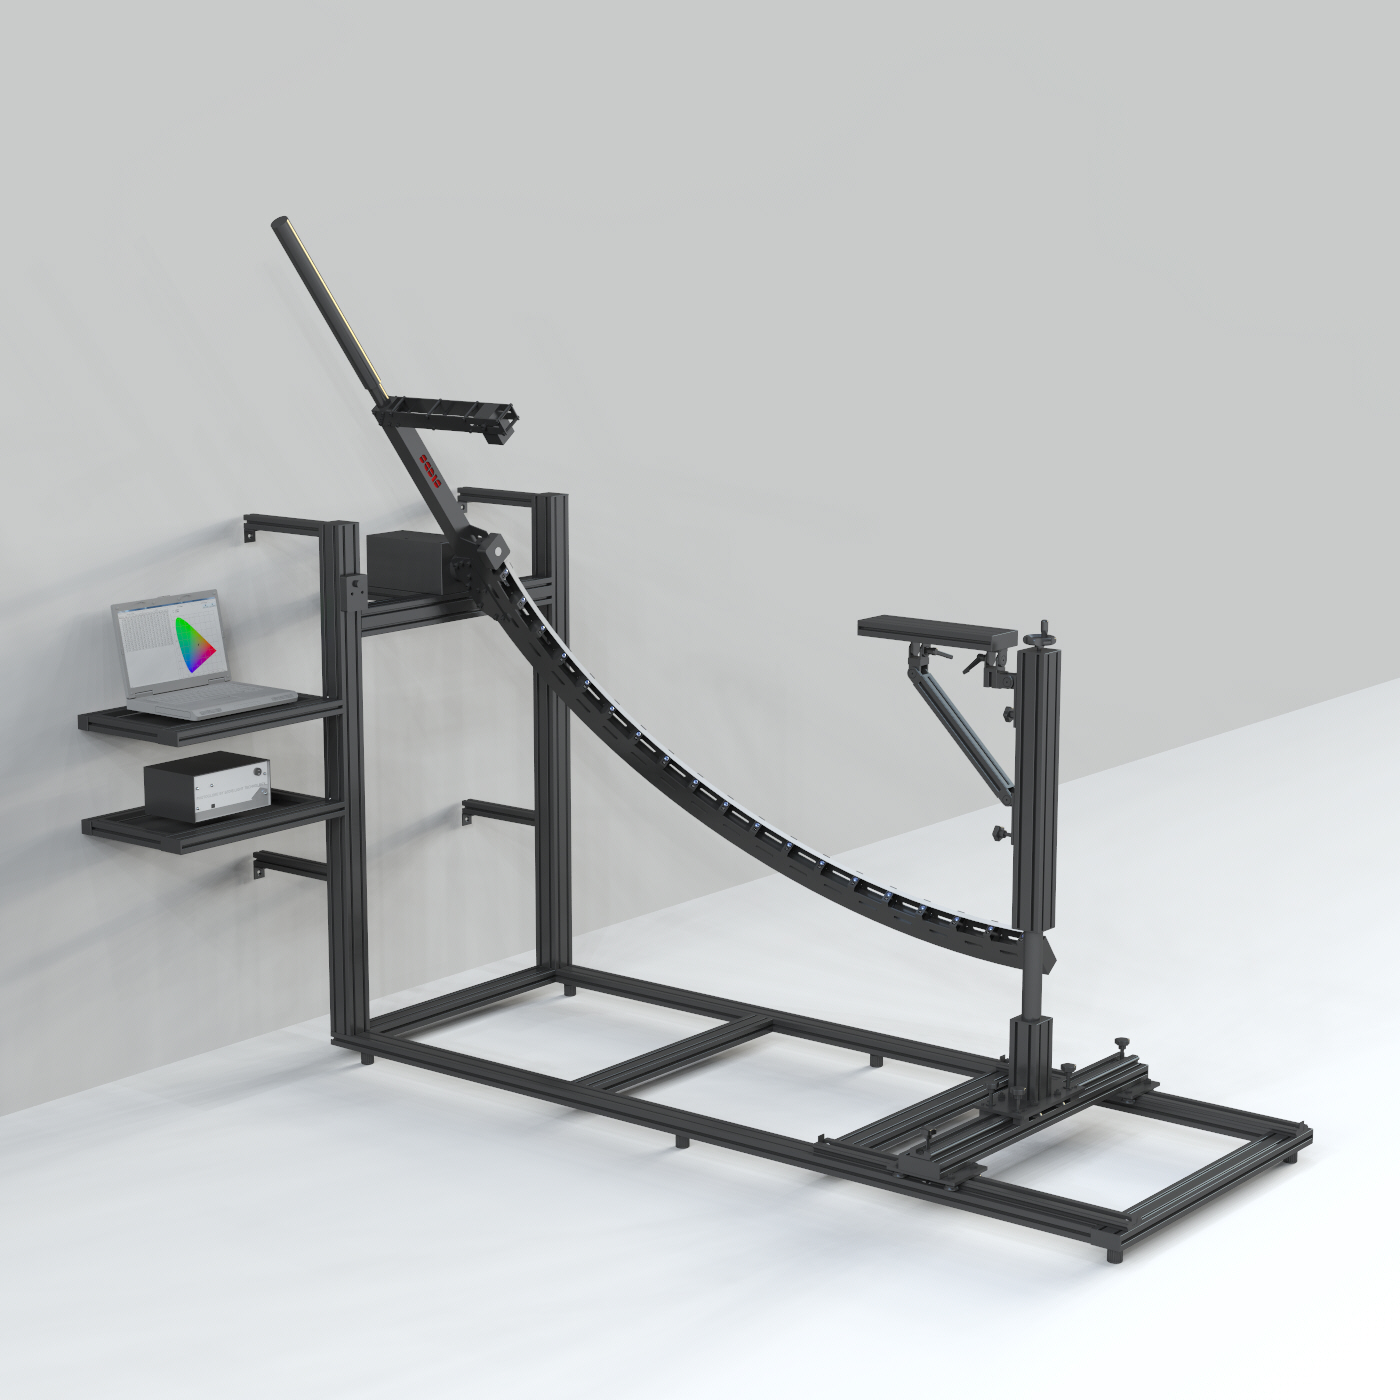
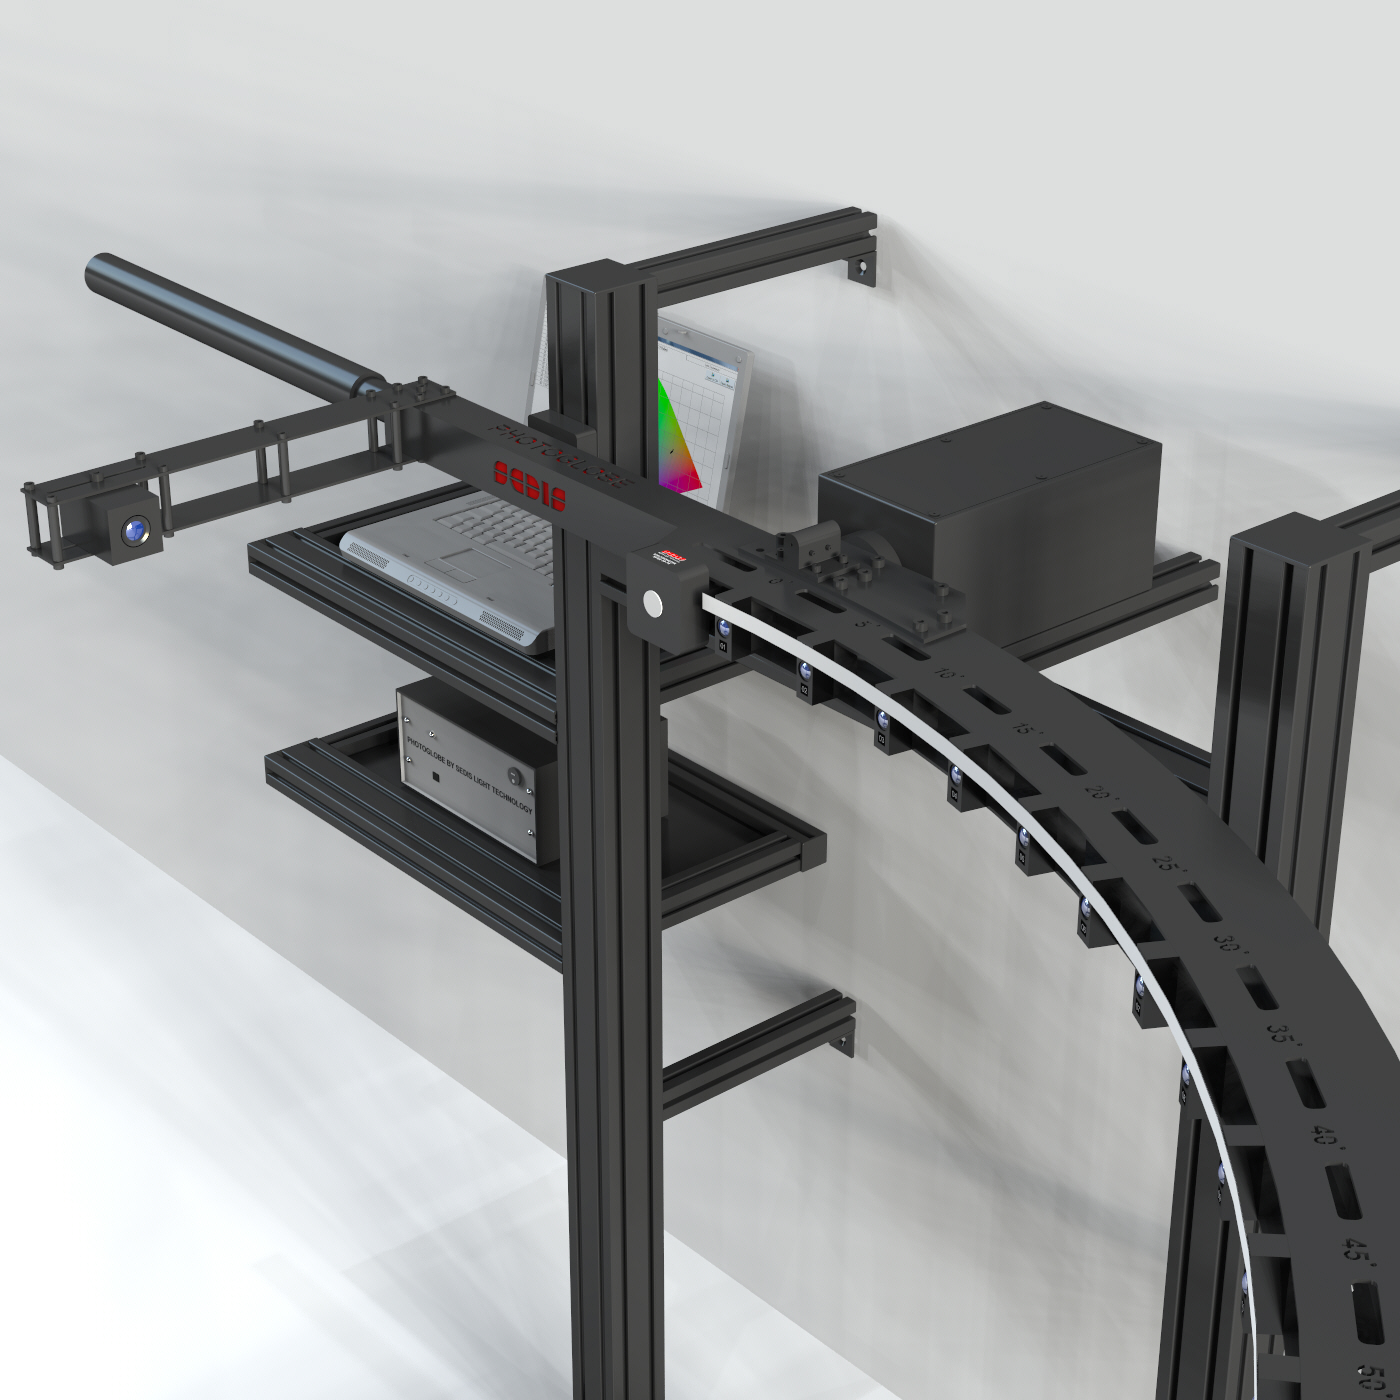
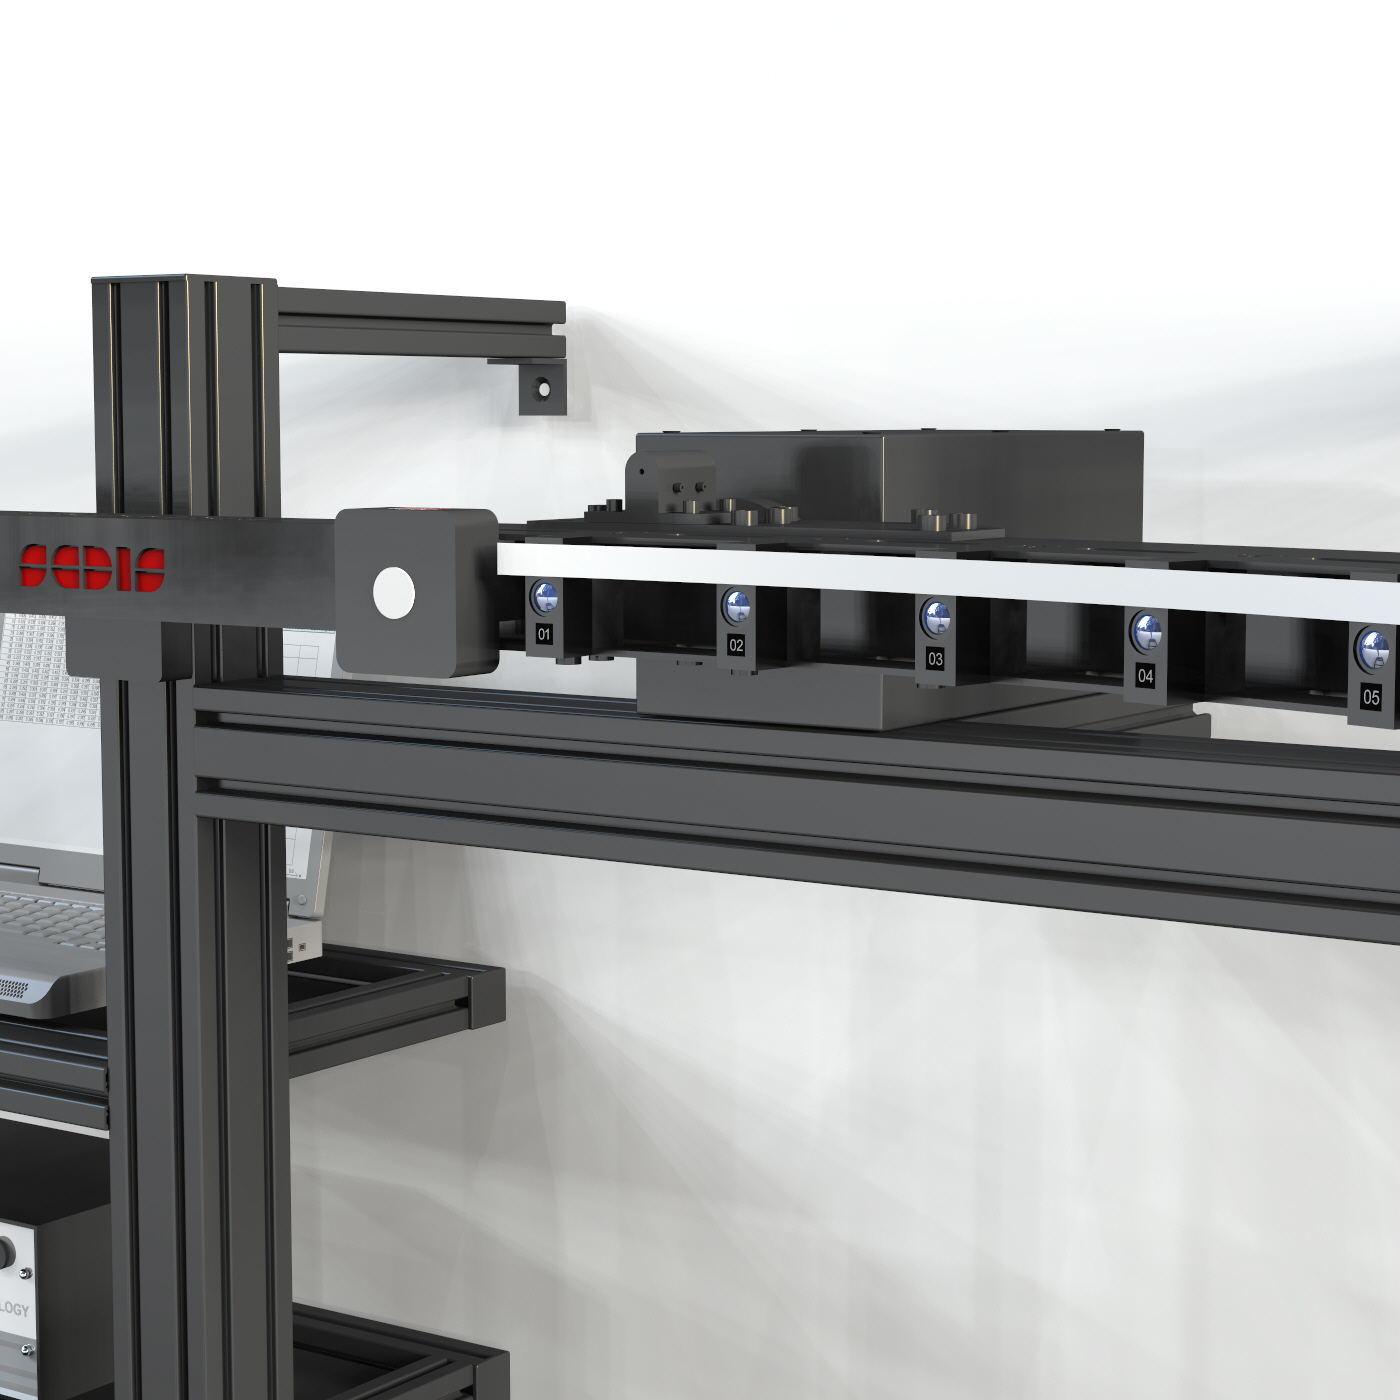
Photoglobe 4FASC is a far-field goniophotometer designed and manufactured by SEDIS Light Technology in Italy. It keeps the luminaire fixed in its operating position throughout the photometric measurement.
Measure the spatial distribution of luminous intensity and luminous flux of luminaires and light sources, and export photometric data in IES and EULUMDAT (LDT) formats.
WHY TO CHOOSE PHOTOGLOBE 4FASC
installation and use within a small room
rapidity of measurement
fixed luminaire position during photometric measurement
measurement of luminaires or light sources in their operating position, whatever it may be
measurement of luminaires weighing up to 70 kg
measurement of luminaires with a maximum size of 2.0 m x 2.0 m
compared to instruments with only one detector, the large number of Photoglobe 4FASC detectors makes it very easy to detect malfunctions
L-class detectors
PTB traceability for illuminance
METAS traceability for chromaticity coordinates and CCT
standard resolution of 1° on Gamma angles
CARRY OUT
absolute measurements
relative measurements
flux measurements for light sources (lm)
evaluation of all the colorimetric parameters according to CIE and IES TM-30-15 standards, along a specific direction or as spatially averaged values
CHECK
luminaire or light source color uniformity
color uniformity between luminaires by means of the MacAdam Ellipse
stabilization of light sources
EXPORT
EULUMDAT format (.ldt)
IESNA format (.ies)
.cvs format – colorimetric data
RETURN
Spatial distribution of luminous intensity
Luminous flux (lm)
Spectral irradiance (µW* cm-2 * nm-1 )
Tristimulus values X, Y, Z
X1 and X2 components of X
Chromaticity coordinates x, y (CIE 1931 colour space)
Chromaticity coordinates u’, v’ (CIE 1976 colour space)
Correlated colour temperature (CCT)
Chromatic Difference (DC)
Colour Rendering Index (CRI)
Colour components (R1, R2, … , R14)
Fidelity Index (according to IES TM 30-15)
Gamut Area Index (GAI) (in accordance with IES TM 30-15)
POST-PROCESSING SOFTWARE
Measurement data are processed by a powerful post-processing software.
The software generates a .PDF measurement report containing, in addition to the above listed data, the following:
efficacy (lm/W)
calculation of the beam of light of luminaires
polar diagram
Cartesian diagram
representation of chromaticity coordinates x, y in CIE 1931 diagram
representation of chromaticity coordinates u’, v’ in CIE 1976 diagram
graphical representation of color components
graphical representation of the Gamut Area
Utilizziamo i cookie per essere sicuri che tu possa avere la migliore esperienza sul nostro sito. Se continui ad utilizzare questo sito noi assumiamo che tu ne sia felice. Ok Privacy policy